Tablas y gráficos de las lluvias recogidas en Villajoyosa durante el periodo otoñal entre los años 2013, 2014, 2015 y 2016.
| L/m2 | 2013 | 2014 | 2015 | 2016 |
|---|---|---|---|---|
| 21-sep | sin datos | 0 | 0 | 0 |
| 22-sep | sin datos | 0 | 0 | 0 |
| 23-sep | sin datos | 0 | 0 | 0 |
| 24-sep | sin datos | 9,8 | 0 | 0 |
| 25-sep | sin datos | 0 | 0 | 0 |
| 26-sep | sin datos | 0 | 0 | 0,2 |
| 27-sep | sin datos | 0 | 3,8 | 0,4 |
| 28-sep | sin datos | 0 | 0 | 7,8 |
| 29-sep | sin datos | 0 | 1,2 | 2 |
| 30-sep | sin datos | 0,2 | 0,2 | 0 |
| 01-oct | sin datos | 0 | 0 | 0 |
| 02-oct | sin datos | 1,8 | 0 | 0 |
| 03-oct | sin datos | 0 | 0 | 0 |
| 04-oct | sin datos | 0 | 0 | 0 |
| 05-oct | sin datos | 0 | 0 | 0 |
| 06-oct | sin datos | 0 | 0 | 0 |
| 07-oct | sin datos | 0 | 0 | 0 |
| 08-oct | sin datos | 0 | 4,8 | 0 |
| 09-oct | sin datos | 0 | 0 | 0 |
| 10-oct | sin datos | 0 | 0 | 0 |
| 11-oct | sin datos | 0 | 0 | 0 |
| 12-oct | sin datos | 1 | 0 | 0 |
| 13-oct | sin datos | 0 | 34 | 2,6 |
| 14-oct | sin datos | 0 | 0 | 0 |
| 15-oct | sin datos | 0 | 0 | 0 |
| 16-oct | sin datos | 0 | 0 | 0 |
| 17-oct | sin datos | 0 | 0 | 0 |
| 18-oct | sin datos | 0 | 0 | 0,4 |
| 19-oct | sin datos | 0 | 0 | 5 |
| 20-oct | sin datos | 0 | 0 | 6,6 |
| 21-oct | sin datos | 0 | 0 | 0,2 |
| L/m2 | 2013 | 2014 | 2015 | 2016 |
|---|---|---|---|---|
| 22-oct | sin datos | 0 | 0 | 0 |
| 23-oct | sin datos | 0 | 0 | 0 |
| 24-oct | sin datos | 0 | 0 | 0 |
| 25-oct | sin datos | 0 | 0,4 | 0 |
| 26-oct | sin datos | 0 | 0,2 | 0 |
| 27-oct | sin datos | 0 | 0 | 0 |
| 28-oct | sin datos | 0 | 0 | 0 |
| 29-oct | sin datos | 0 | 0 | 0 |
| 30-oct | sin datos | 0 | 0 | 0 |
| 31-oct | sin datos | 0 | 0 | 0 |
| 01-nov | sin datos | 0 | 0 | 0 |
| 02-nov | sin datos | 0 | 0 | 0 |
| 03-nov | sin datos | 0 | 0 | 0 |
| 04-nov | sin datos | 0 | 0 | 0 |
| 05-nov | sin datos | 0 | 0 | 0 |
| 06-nov | sin datos | 0 | 0 | 0 |
| 07-nov | sin datos | 0 | 0 | 1,2 |
| 08-nov | sin datos | 3 | 0 | 0 |
| 09-nov | sin datos | 0,2 | 0 | 0 |
| 10-nov | sin datos | 0 | 0 | 0 |
| 11-nov | sin datos | 2,8 | 0 | 0 |
| 12-nov | sin datos | 0 | 0 | 0 |
| 13-nov | sin datos | 0 | 0 | 0 |
| 14-nov | sin datos | 0 | 0 | 5,2 |
| 15-nov | sin datos | 0,4 | 0 | 2,6 |
| 16-nov | sin datos | 0 | 0 | 0 |
| 17-nov | sin datos | 0 | 0 | 0 |
| 18-nov | sin datos | 0 | 0 | 0 |
| 19-nov | sin datos | 0 | 0 | 0 |
| 20-nov | sin datos | 0 | 0 | 0 |
| 21-nov | sin datos | 0 | 0 | 0 |
| L/m2 | 2013 | 2014 | 2015 | 2016 |
|---|---|---|---|---|
| 22-nov | sin datos | 0 | 0 | 1 |
| 23-nov | sin datos | 0 | 0 | 18,2 |
| 24-nov | sin datos | 0 | 0 | 0 |
| 25-nov | sin datos | 0 | 0 | 0 |
| 26-nov | sin datos | 0 | 0 | 0,4 |
| 27-nov | sin datos | 0,8 | 0 | 7,8 |
| 28-nov | sin datos | 2,2 | 0 | 0,2 |
| 29-nov | sin datos | 4,8 | 0 | 5,6 |
| 30-nov | sin datos | 0 | 0 | 1,2 |
| 01-dic | sin datos | 2,6 | 0 | 0 |
| 02-dic | sin datos | 0 | 0 | 0 |
| 03-dic | sin datos | 0 | 0 | 0 |
| 04-dic | sin datos | 3,6 | 0 | 5,2 |
| 05-dic | sin datos | 0 | 0 | 8,4 |
| 06-dic | sin datos | 0 | 0 | 3,8 |
| 07-dic | sin datos | 0 | 0 | 0 |
| 08-dic | sin datos | 0 | 0 | 0 |
| 09-dic | sin datos | 0 | 0 | 0 |
| 10-dic | sin datos | 0 | 0 | 0 |
| 11-dic | sin datos | 0 | 0 | 0 |
| 12-dic | sin datos | 0 | 0 | 0 |
| 13-dic | sin datos | 0 | 0 | 0 |
| 14-dic | sin datos | 14,2 | 0 | 0 |
| 15-dic | sin datos | 16 | 0 | 0,4 |
| 16-dic | sin datos | 0 | 0 | 13,4 |
| 17-dic | sin datos | 0 | 0 | 19,8 |
| 18-dic | sin datos | 0 | 0 | 21,8 |
| 19-dic | sin datos | 0 | 0 | 58,8 |
| 20-dic | sin datos | 0 | 0 | 0 |
| 21-dic | sin datos | 0 | 0 | 0 |
Fuente: Web Datosclima
Fuente: Elaboración propia a partir datos Aemet.
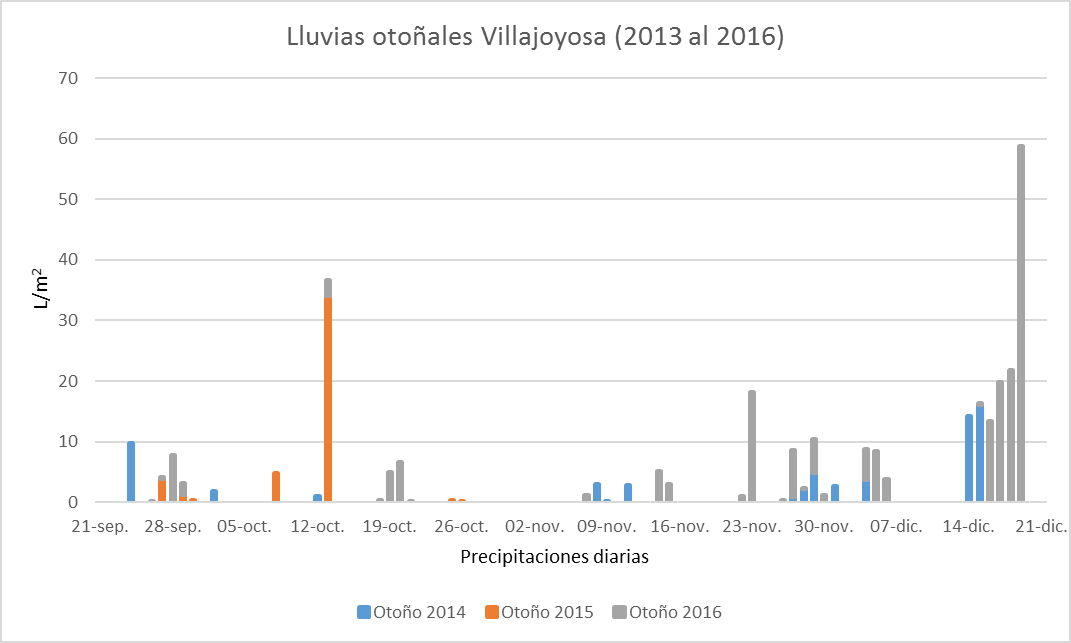
Comentario del gráfico
En este gráfico de barras.......
Fuente: Elaboración propia a partir datos Aemet.
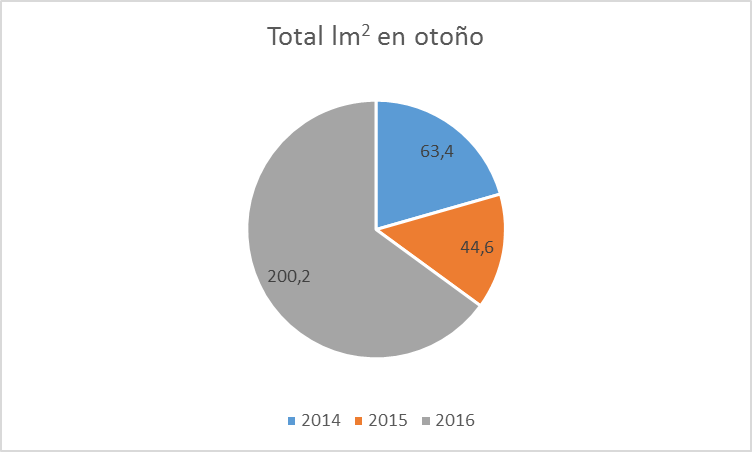
Comentario del gráfico
En este gráfico ciruclar.......